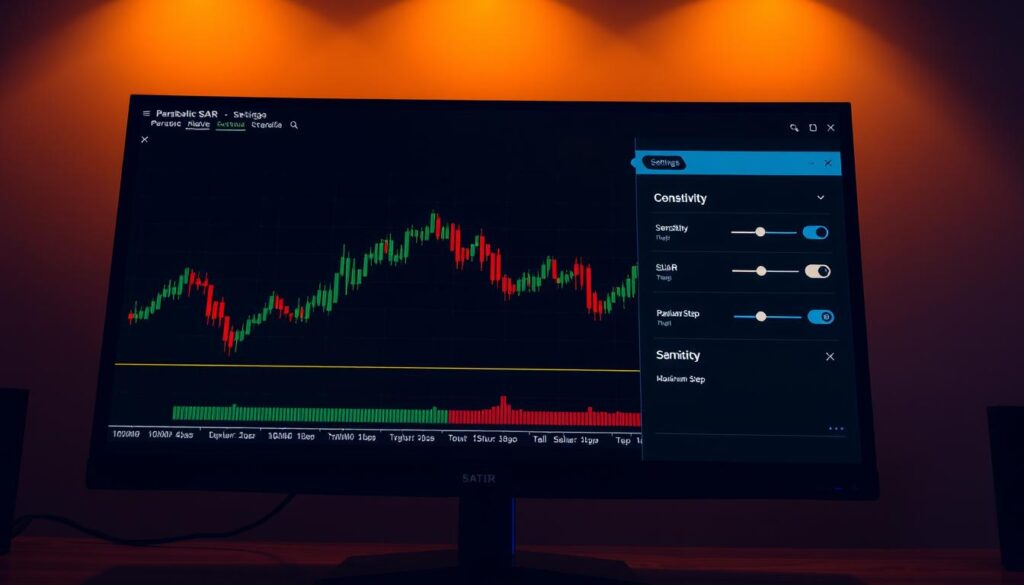
Parabolic SAR MT4 indicator: A Comprehensive Guide
When analyzing financial markets, traders need tools that provide clear signals. Developed by J. Welles Wilder Jr. in 1978, this technical system helps identify trends and potential reversals. It appears as dots above or below price bars, offering visual cues about market direction.
The method operates on the “Stop and Reverse” principle. As trends gain momentum, the dots move closer to prices, creating dynamic trailing stops. This feature allows traders to stay in trades during strong trends while managing risk effectively.
Wilder, known for creating the Relative Strength Index, designed the Parabolic SAR to adapt to changing conditions. Unlike static tools, it accelerates with price movements, providing timely exit signals. Its effectiveness shines in trending markets, capturing extended moves without premature exits.
Understanding this approach is crucial for systematic strategies. By combining trend analysis with risk management, it serves as a valuable component in a trader’s toolkit.
Understanding the Fundamentals of the Parabolic SAR
Market analysis tools thrive on adaptability, and one method stands out for its dynamic approach to trend tracking. This system uses geometric patterns to signal shifts in momentum, helping traders spot opportunities while managing risk.
What Is This Tool and How Does It Function?
The mechanism plots points below prices during uptrends and above them during downtrends. When prices cross these markers, it suggests a possible change in market direction. These visual cues act as trailing stops, automatically adjusting as markets move.
Two core elements drive its calculations. The acceleration factor starts at 0.02 and grows by 0.02 with each new high or low, capping at 0.20. This gradual increase makes the tool more responsive as trends strengthen. Meanwhile, the extreme point tracks the most significant price level in the current trend.
Core Mechanics: Acceleration and Extremes
Here’s how these components interact:
- Strong trends trigger faster adjustments through rising acceleration values
- New price extremes update both the acceleration factor and stop levels
- Longer trends see markers converge closer to prices for tighter risk control
This combination allows the system to balance sensitivity with reliability. Traders gain clearer signals about when to hold positions or prepare for reversals, making it particularly useful in markets showing sustained momentum.
Exploring the Parabolic SAR MT4 indicator on Trading Platforms
Clarity in trend identification separates successful strategies from guesswork. Modern platforms integrate sophisticated systems that automatically adjust to market shifts. These tools help traders spot momentum changes while maintaining risk control through dynamic calculations.
Understanding the Calculation Method
The core formula combines previous values with acceleration factors and extreme prices. Here’s how it works:
- Each new value builds on the prior calculation
- Acceleration increases as trends strengthen
- Extreme price points reset during reversals
This approach creates self-adjusting markers that follow price action closely. When markets accelerate, the system tightens its trailing stops automatically.
Interpreting Visual Market Signals
Dots positioned below price bars suggest upward momentum, while those above indicate downward pressure. A crossover between prices and dots often signals potential trend changes. Traders use these patterns to:
- Confirm existing market directions
- Identify exit points before reversals
- Gauge momentum strength through dot spacing
Strong trends display tightly clustered dots that move rapidly with prices. This visual feedback helps traders make decisions without complex calculations.
Setting Up and Configuring the Parabolic SAR in MT4
Customizing technical tools enhances decision-making precision for traders. The process involves balancing default recommendations with personal strategy adjustments. Proper configuration ensures alignment with market conditions and individual risk tolerance.
Default Settings vs Customized Options
Most trading platforms retain the creator’s original parameters for this tool. The default step value (0.02) and maximum threshold (0.20) suit trending markets. Wilder’s research suggests values between 0.018-0.021 maintain effectiveness without excessive sensitivity.
Lower step values create wider gaps between markers and prices, ideal for volatile conditions. Higher maximum settings allow faster adjustments during strong trends. However, exceeding 0.22 often causes premature reversals in backtests.
Step-by-Step Guide to Adding the Indicator
Open the Navigator panel and select the Trend category under Indicators. Double-click the tool’s name to apply it to your chart. Adjust parameters in the pop-up window before confirming.
Testing configurations on a demo account helps identify optimal combinations. Traders observe how spacing between dots changes with different values. This practical approach builds confidence before live implementation.
Advanced Trading Strategies with the Parabolic SAR MT4 indicator
Traders seeking precision often refine their approach through layered techniques. By combining core principles with innovative adaptations, they unlock new opportunities in dynamic markets.
Entry and Exit Signal Techniques
The foundational strategy involves acting when prices cross the tool’s markers. Buy positions activate when candles close above the dots, while sell signals trigger when prices drop below. This stop-and-reverse system automatically closes trades and opens counter positions during reversals.
To reduce false signals, many wait for two consecutive closes beyond the markers. This filters out temporary price spikes, increasing confidence in trend changes.
Utilizing the Double Approach
Seasoned traders often analyze multiple timeframes simultaneously. A daily chart might determine the broader trend, while hourly data pinpoints entry points. This method ensures trades align with dominant market directions.
For example, if weekly dots sit below prices, traders focus solely on long positions in shorter timeframes. This layered analysis minimizes counter-trend risks.
Integrating with Other Technical Indicators
Combining this tool with momentum oscillators strengthens decision-making. The Average Directional Index (ADX) helps confirm trend strength, while moving averages validate direction. Key benefits include:
- Reduced false signals through multi-indicator confirmation
- Dynamic stop-loss adjustments using trailing dot positions
- Clear trend identification in volatile forex markets
Many professionals add volume analysis to assess buying pressure behind price movements. This creates robust systems adaptable to various market conditions.
Best Practices and Risk Management with the Indicator
Effective trading strategies balance opportunity with protection. Implementing disciplined methods helps traders stay aligned with market rhythms while safeguarding capital.
Using Stop-Loss and Trailing Stop Techniques
Dynamic exit points adapt to changing conditions. The system’s dots act as moving barriers that tighten as trends progress. Three key applications:
- Set initial barriers two pips beyond recent price extremes to avoid false triggers
- Let winning trades run by allowing automatic barrier adjustments
- Combine with momentum tools like the strength index for confirmation
This approach protects accounts during sudden reversals. Demo testing reveals how different markets respond to these safeguards over various periods.
Position Sizing and Trade Management
Smart exposure control separates sustainable strategies from reckless gambling. Consider these guidelines:
- Limit single trades to 2% of total account value
- Adjust volumes based on market volatility analysis
- Use historical data to identify optimal entry points
Regular portfolio reviews help maintain balance. Many professionals compare relative performance across markets to allocate resources effectively.
Proper implementation turns theoretical concepts into practical safeguards. Through careful planning and continuous analysis, traders build resilience against unpredictable shifts.
Wrapping Up Your Parabolic SAR MT4 Journey
Mastering market dynamics demands tools that evolve with price action. The Parabolic SAR combines trend identification, entry signals, and dynamic risk management in one visual package. Its trailing stop-loss feature adapts to market speed, offering protection during volatile swings.
While available across major platforms like MetaTrader 4, success requires strategic enhancements. Traders often pair it with volume metrics or momentum oscillators to filter false signals. This layered approach works best when markets show clear directional momentum rather than sideways movement.
Remember – no tool guarantees perfect accuracy. The system thrives when users understand its acceleration mechanics and market context. Those who study historical patterns and test strategies in demo environments typically achieve better consistency.
Keep these final tips in mind:
- Prioritize trending forex pairs over range-bound assets
- Adjust acceleration values based on volatility scans
- Combine with weekly charts to confirm broader directions


